Filtering and Merging latent factors
We recommend running Maui with a large number of latent factors (e.g. 100), even when we expect the latent space to be of lower dimension. This way we are more likely to capture latent factors which are interesting, and the uninteresting ones can be dropped later before down-stream analysis. Maui comes with some functionality to that end.
Dropping unexplanatory latent factors
An unsupervised way to drop latent factors with low explanatory power, is to fit linear models predicting the input x from the latent factorz z. The Maui Utilities have a function which does this. For each latent factor, a linear model is fit, predicting all input features from each latent factor. Then, the R-square is computed. Factors with an R-square score below some threshold are dropped.
-
maui.utils.filter_factors_by_r2(z, x, threshold=0.02)[source]¶ Filter latent factors by the R^2 of a linear model predicting features x from latent factors z.
z: (n_samples, n_factors) DataFrame of latent factor values, output of a maui model x: (n_samples, n_features) DataFrame of concatenated multi-omics data
- z_filtered: (n_samples, n_factors) DataFrame of latent factor values,
- with only those columns from the input z which have an R^2 above the threshold when using that column as an input to a linear model predicting x.
The functionality is also available directly on a trained Maui model (The Maui Class), which exposes a function which drops unexplanatory factors in-place:
-
maui.Maui.drop_unexplanatory_factors(self, threshold=0.02)¶ Drops factors which have a low R^2 score in a univariate linear model predicting the features x from a column of the latent factors z.
- threshold: threshold for R^2, latent factors below this threshold
- are dropped.
- z_filt: (n_samples, n_factors) DataFrame of latent factor values,
- with only those columns from the input z which have an R^2 above the threshold when using that column as an input to a linear model predicting x.
Merging similar latent factors
Some times running Maui with a large number of latent factor can produce embeddings which are similar to one another. For instance, a heatmap of latent factor values may look like this:
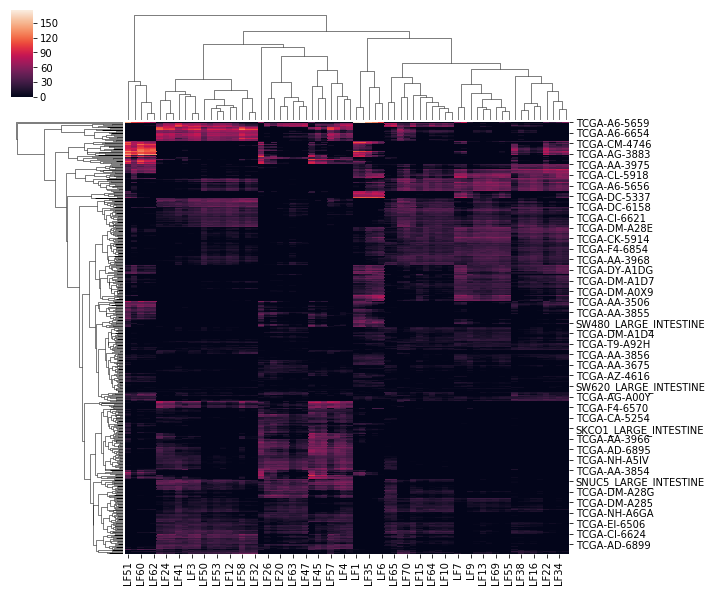
Heatmap of latent factors shows many latent factors are very similar.
The latent factors may be clustered and merged to produce a more succinct, even lower-dimension representation of the data, without losing much information
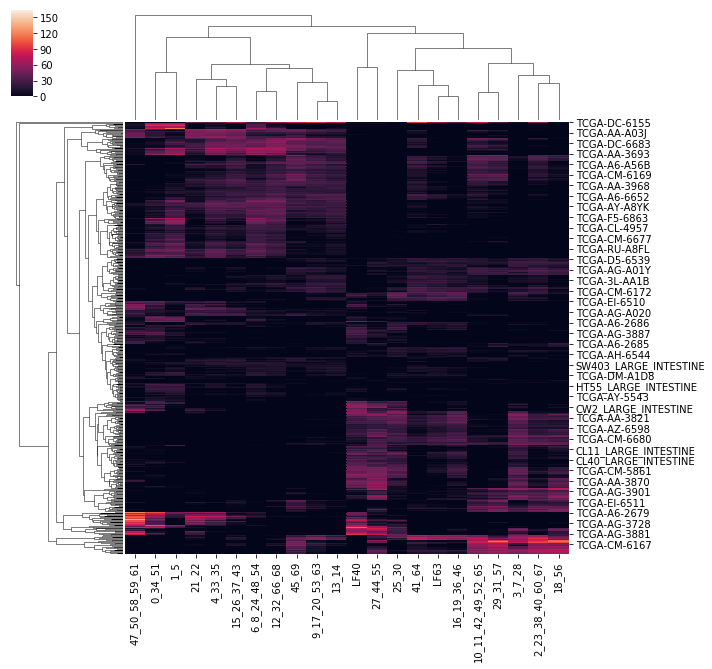
Heatmap of latent factors after they have been merged by similarity values.
Maui Utilities provides functionality to merge latent factors based on arbitrary distance metrics:
-
maui.utils.merge_factors(z, l=None, threshold=0.17, merge_fn=<function mean>, metric='correlation', linkage='single', plot_dendro=True, plot_dendro_ax=None)[source]¶ Merge latent factors in z which form clusters, as defined by hierarchical clustering where a cluster is formed by cutting at a pre-set threshold, i.e. merge factors if their distance to one-another is below threshold.
z: (n_samples, n_factors) DataFrame of latent factor values, output of a maui model metric: Distance metric to merge factors by, one which is supported by
scipy.spatial.distance.pdist()- linkage: The kind of linkage to form hierarchical clustering, one which is
- supported by
scipy.cluster.hierarchy.linkage() - l: As an alternative to supplying metric and linkage, supply a
- linkage matrix of your own choice, such as one computed by
scipy.cluster.hierarchy.linkage() - threshold: The distance threshold. latent factors with similarity below the
- threshold will be merged to form single latent facator
- merge_fn: A function which will be used to merge latent factors. The default
- is
numpy.mean(), i.e. the newly formed (merged) latent factor will be the mean of the merged ones. Supply any function here which has the same interface, i.e. takes a matrix and an axis. - plot_dendro: Boolean. If True, the function will plot a dendrogram showing
- which latent factors are merged and the threshold.
And functionality for the base case where factors are merged by correlation is provided in the Maui model calss:
-
maui.Maui.merge_similar_latent_factors(self, distance_in='z', distance_metric='correlation', linkage_method='complete', distance_threshold=0.17, merge_fn=<function mean>, plot_dendrogram=True, plot_dendro_ax=None)¶ Merge latent factorz in z whose distance is below a certain threshold. Used to squeeze down latent factor representations if there are many co-linear latent factors.
- distance_in: If ‘z’, latent factors will be merged based on their distance
- to each other in ‘z’. If ‘w’, favtors will be merged based
on their distance in ‘w’ (see
get_linear_weights()) - distance_metric: The distance metric based on which to merge latent factors.
- One which is supported by
scipy.spatial.distance.pdist() - linkage_method: The linkage method used to cluster latent factors. One which
- is supported by
scipy.cluster.hierarchy.linkage(). - distance_threshold: Latent factors with distance below this threshold
- will be merged
- merge_fn: Function used to determine value of merged latent factor.
- The default is
numpy.mean(), meaning the merged latent factor will have the mean value of the inputs. - plot_dendrogram: Boolean. If true, a dendrogram will be plotted showing
- which latent factors are merged and the threshold.
plot_dendro_ax: A matplotlib axis object to plot the dendrogram on (optional)
- z: (n_samples, n_factors) pd.DataFrame of latent factors
- where some have been merged
Supervised filtering of latent factors
In the case of patient data, latent factors may be assessed for usefulness based on how predictive they are of patient survival. Maui includes functionality to do this in the utilities class:
-
maui.utils.select_clinical_factors(z, survival, duration_column='duration', observed_column='observed', alpha=0.05, cox_penalizer=0)[source]¶ Select latent factors which are predictive of survival. This is accomplished by fitting a Cox Proportional Hazards (CPH) model to each latent factor, while controlling for known covariates, and only keeping those latent factors whose coefficient in the CPH is nonzero (adjusted p-value < alpha).
- survival: pd.DataFrame of survival information and relevant covariates
- (such as sex, age at diagnosis, or tumor stage)
- duration_column: the name of the column in
survivalcontaining the - duration (time between diagnosis and death or last followup)
- observed_column: the name of the column in
survivalcontaining - indicating whether time of death is known
- alpha: threshold for p-value of CPH coefficients to call a latent
- factor clinically relevant (p < alpha)
cox_penalizer: penalty coefficient in Cox PH solver (see
lifelines.CoxPHFitter)- z_clinical: pd.DataFrame, subset of the latent factors which have been
- determined to have clinical value (are individually predictive of survival, controlling for covariates)
For a more comprehensive example, check out our vignette.